PGO, But Better
Finding spare performance down the back of the sofa.

Let’s talk branch prediction. Because the modern CPU pipeline is optimised to fetch and decode instructions in advance of their actual execution, any control statement that branches those instructions along two or more paths presents a serious problem. In the if-else statement
1
2
3
4
5
6
7
8
9
10
11
void foo()
{
    if (/* branch condition */)
    {
        // branch a
    }
    else
    {
        // branch b
    }
}
the CPU doesn’t know which branch it’s taking at time of fetching line 3 - but to wait until that branch condition has been decoded, executed and evaluated before fetching its next instruction would bring the entire pipeline to a standstill. for loops and while loops too branch at every iteration on deciding whether to terminate the loop.
Now, stalling at a single branch condition would only cost us ~20 clock cycles, the fundamental units of CPU time. On modern microprocessors that’s in the order of about ~10ns, but along the hotter paths of your codebase these stalls add up. That’s why, on fetching a branch condition, the CPU uses a branch predictor to guess which path it’s going to take. Instructions along that predicted path can then be fetched, decoded and speculatively executed, their results stored in temporary buffers, in the gap before the condition is evaluated. If our prediction is correct that work is committed immediately (Agner Fog’s Optimizing Software in C++ puts the overhead of a correctly-predicted branch instruction at 0-2 cycles all told). If we are wrong, however, the speculative work gets flushed and we start processing the actual branch, those ~20 wasted clock cycles constituting our branch misprediction penalty.
This was going to be a blog about branch prediction. This was going to be a blog about how dynamic branch prediction algorithms do (and don’t) work. This was going to be about how I’ve been integrating best branch prediction practices into my ongoing work on Bad Bohemians… but then I got bored and went and overhauled some build pipelines instead. oops!!
Profile-Guided Optimisation (PGO)
Clang - or more accurately, LLVM, the middle/back-end compiler Clang is built on - comes with a suite of tools for profile-guided optimisation. The central conceit is, if we identify the hot/cold paths of a game’s code in a real playthrough, the compiler can use this information to better improve subsequent builds. Playing an instrumented build will accumulate raw telemetry data, data which together form a profile of the game. This gets fed back into LLVM to, surprise surprise, guide its optimisations: hot paths will be tuned for performance, cold paths for size.
What do these optimisations look like in practice? In the case of branch predictions, we track branch frequencies in the telemetry data. The compiler can then reorganise the code to place more likely paths sooner after each branch condition, which is most efficient for the resulting machine code.1 Crucially, this is all done statically - the final PGO-optimised program won’t be bloated by any telemetry data, those are only needed at compile-time!
1 That's also why C++ 20 introduced the [[likely]] and [[unlikely]] attributes, for what it's worth.
Other common optimisations include:
- Function inlining
- Function reordering
- Virtual call speculation
- Memory intrinsics
- Register allocation
…Several of which well deserve blog posts of their own. However, for today’s purposes I’m happy to treat the optimisations themselves as something of a black box. This discussion is about where and how we collect telemetry data, not so much what we do with it.
The theory here is largely a rehashing of Amir Aupov’s The Many Faces of PGO and FDO, mixing in some reasoning behind how I’ve integrated it in personal and professional projects myself. For instance, all the techniques and compiler flags I mention here are used for instrumented PGO, where the compiler inserts profiling tools directly into builds. Instrumentation introduces some overhead, and might even have an observer effect on its readings, but can be trusted to return exact call counts and precise timings. Not covered are alternatives like sampling PGO, which would mean profiling with an external tool like perf and sacrificing granularity for convenience (we don’t need a ‘special’ build for sampling). Aupov suggests this is the better choice for, e.g., web servers, but between Android development at Feral and experimenting with Godot at home, I’m satisfied instrumentation is suitable for optimising games. I’ll be using “PGO” as shorthand for “instrumented PGO” going forward, then.
 Improve CPU times with ONE WEIRD TRICK!! Instrumented PGO is a multi-stage process. Playing with instrumentation accrues raw telemetry data in a directory of
 .profraw files. Running command llvm-profdata merge --output=<filename>.profdata *.profraw within this directory will then package these into a single .profdata profile, to pass back to the compiler for the upcoming optimised build.
Front-End (FE) PGO
Front-end PGO is, if not the best form of PGO, certainly the most intuitive. With this method, instrumentation is inserted more or less where you’d expect: by Clang, at the source level, right at the start of the LLVM toolchain… but what does that actually entail?
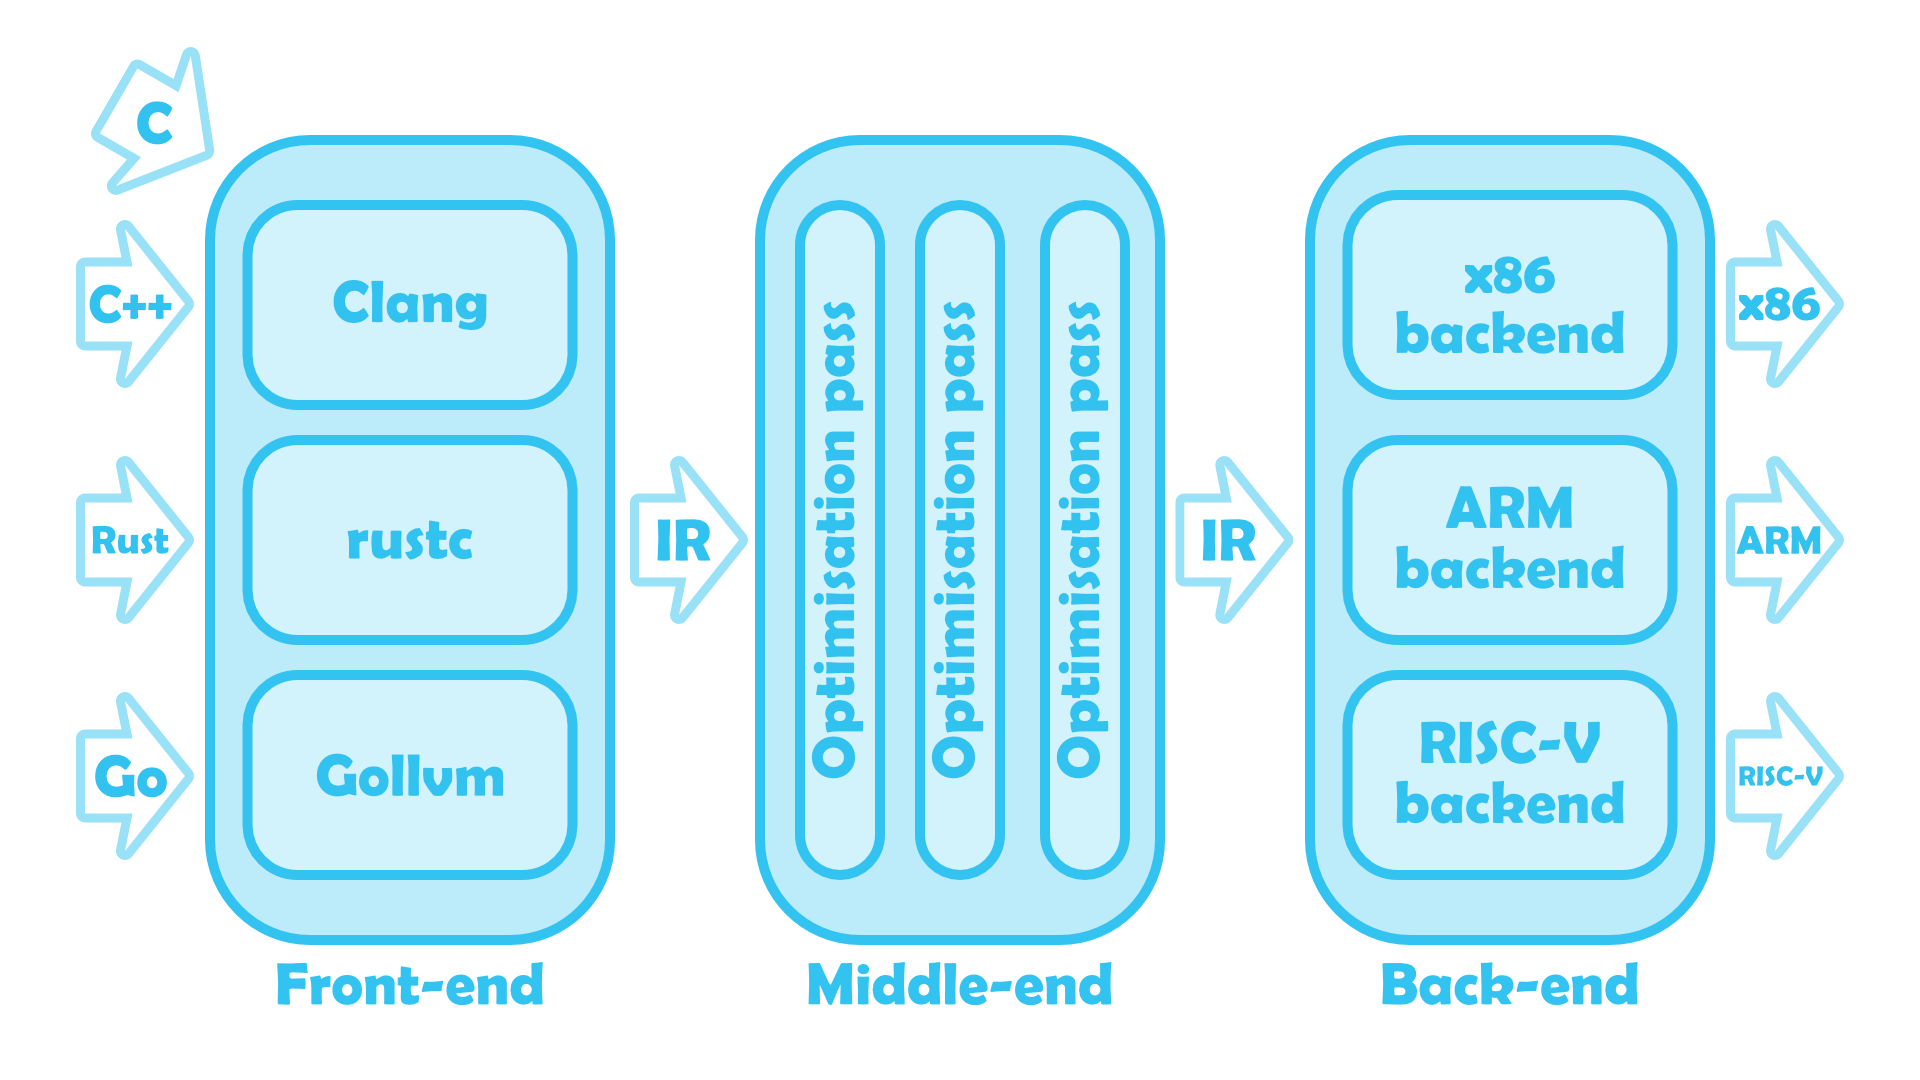 The LLVM Toolchain, compiling source code into machine code.
If you’re unfamiliar, modern compiler architecture consists of three main components. First, there is the front-end that interfaces directly with source code in whatever language it’s written it. LLVM parses C/C++ with Clang, for instance, Rust with rustc, Go with Gollvm, and so on. The front-end is the only part of the pipeline that isn’t language-agnostic: its sole purpose is translating your work to read more like assembly, standardising any of the its supported languages into one intermediate representation (IR) the rest of the toolchain can understand.
Intermediate representations of code are then ready to be fed into the middle-end of the compiler, LLVM proper. This is where optimisations happen through a series of passes that ‘rotate’ loops into do-while loops (loop-rotate), strip dead code (simplifycfg), and much, much more.2 The LLVM middle-end is nice and modular by design, and it’s very easy to enable, disable, or even hack in custom passes without borking the entire toolchain. What makes this possible, and what makes LLVM so special when taken as a whole, is each of its passes represents input and output code the same way (apparently unusual amongst compilers).
2 Annie Cherkaev has a great explainer on what these optimisations look like under the hood. Highly recommend it, especially if (like me) you're not normally interested in reading low-level IR/assembly.
Knowing the front-end maps source code to IR, and the middle-end IR to IR, it’ll come as no surprise that the back-end is what finally gives us our actual machine code. Much like the finer details of the front-end vary language-to-language, so too will this part of the toolchain vary instruction set-to-instruction set: x86, ARM, hell, even RISC-V if you’re into that sort of thing. For the purposes of this article, there’s actually only one detail we do need to know - because the back-end doesn’t apply its own optimisations, we can ignore it altogether!
This is all a roundabout way of saying that yes, front-end instrumentation is added at the front-end of a compiler. The benefit of this is its strong source correlation, a must for assessing the code coverage of a given set of unit tests. FE PGO is an altogether less useful use case for front-end instrumentation, but for the sake of completeness I’ve still included the associated compiler flags below.
Clang flags -fprofile-instr-generate, -fprofile-instr-use=<path/to/.profdata>
Intermediate Representation (IR) PGO
The alternative to FE PGO would be holding off instrumenting until the middle-end, once the compiler has already started making optimisations. Thanks to LLVM’s modularity it is absolutely possible to slot an IR instrumentation pass into the toolchain, and, because the IR will be partway optimised once it gets here, that instrumentation will incur a much lower run-time overhead. This is intermediate representation PGO, and for the avoidance of any doubt - it’s just better.
By improving the performance of instrumented builds, we improve the quality of the resulting profiles. The observer effect I mentioned earlier, that’s what happens when instrumentation creates bottlenecks where they don’t already exist, or where it slows a program down to the point it takes a different execution path than it would otherwise. Misidentifying hot paths as cold means optimising them for size rather than speed, a real risk of FE PGO.
And instrumenting the IR isn’t just more accurate, it’s more tolerable. Whether it’s you or QA collecting the telemetry data, it’s always better when your build runs more like a game than a slideshow. Making internal builds more performant is a quality-of-life improvement, but it also has tangible benefits on the development cycle. No instrumented build will ever be viable for performance checks, but unlike FE, these ones can at least be playtested while gathering data.
Last of all, IR .profraws are significantly smaller. I wouldn’t have expected this to have any implications outside of instrumented builds, but I did come across one lead on a recent-ish blog about compiling Rust with PGO. Exporting .profraws with a %p in their filepath will create one file per process, avoiding race conditions when multiple threads try to write telemetry data to a single file. It’s a marginal improvement to profile’s precision that for a marginal improvement in performance, but even IR PGO might need several GB available to store all those extra .profraw files. Admittedly, I’ve not tested this trick on my own work because Bad Bohemians doesn’t have enough multithreading to be worthwhile, and I’ve not tested it at Feral for fear of generating too much data for Android/iOS test devices to handle; if anyone decides to take one for the team, do sound off in the comments below!
Does FE PGO have anything going for it? In the interests of balance, I have heard, anecdotally, that IR telemetry data deprecate faster than FE… but if your game genuinely needs PGO you’ll have to collect fresh data for release candidates regardless, so this basically doesn’t matter.
Clang flags -fprofile-generate, -fprofile-use=<path/to/.profdata>
Context-Sensitive (CS) PGO
Of course, that’s not to suggest IR PGO doesn’t have other, more meaningful limits. Suppose our earlier function foo is inlined in two other functions, bar and baz:
1
2
3
4
5
6
7
8
9
void bar()
{
	foo() // usually takes branch a
}

void baz()
{
	foo() // usually takes branch b
}
If bar and baz get called at about the same frequency, FE and IR PGO will both register that foo takes each branch with about the same probability, and prediction will fail about half the time. By instead adding instrumentation after inlining takes place, each instance of an inlined function gets profiled and optimised independently of any others. bar::foo can safely be arranged to prioritise branch a, and baz::foo branch b. We are gathering and applying separate telemetry data for the several contexts a single function gets inlined: hence, context-sensitive PGO.
Taking all three methods into account, IR PGO is still be expected to give the biggest gains. Don’t get me wrong, CS PGO greatly improves inlined functions, but it just isn’t all that powerful on its own. That’s why we’re lucky CS instrumentation can be layered on top of an already IR-optimised program, the two phases of telemetry data eventually being merged together to fine-tune a third and final build. If you’re willing to accept one more stage in your pipeline, CSIR PGO really is the gold standard for profile-guided optimisations.
 QA testers HATE him!! Depending on the scope of your game CSIR PGO (any PGO, to be honest) might be overkill. If you’re working with dedicated QA tester(s), let them decide whether the performance gains they’re seeing justify the multi-stage builds, and coordinate when you send over instrumented builds to minimise disruptions to their schedule. Short of a benchmarking suite that can replicate the workload of actual playthroughs, it’ll be QA that’s putting in the man hours to collect your telemetry data, after all - be consistently and vocally grateful to them!
Clang flags -fcs-profile-generate, -fprofile-use=<path/to/.profdata>
Temporal Profiling
This last one’s for my fellow mobile devs. A few years ago now, the compiler team at Meta set their sights on a peculiar bottleneck: page faults. When an application tries to access a page of (virtual) memory that isn’t mapped to a page frame of (physical) RAM, the CPU’s memory management unit throws an exception and waits for the OS to fetch that page from disk. Without the jargon, loading data/code into memory wastes time, especially when launching a program completely cold. This is uniquely problematic for mobile games, where users take shorter, more frequent play sessions than on console or PC, and cold start-up performance has a more significant impact on engagement and retention,
The innovation here is temporal profiling, and it’s surprisingly intuitive. Over a profiled run, we take a timestamp the first time each function is called, with which they can be ordered into a single function trace. Using one or more such traces, the compiler identifies which functions are likely to be called in close succession at start-up and stores them nearby in memory, reducing the number of pages the app has to load completely cold. This one change can cut down page faults by up to 40%. It’s easy to integrate it into your build process too: if you’re already running IR PGO, you just need to enable an extra -pgo-temporal-instrumentation flag during your first, IR-instrumented build.
Of course, temporal profiling isn’t going to be useful for everyone; even in my own experiments, I’m yet to see a good reduction in start-up times or page faults. I suspect this is because the mobile ports I’m working on have substantially more assets/data than the average app, so cold starts are bound by that more so than the code? …It’s a shaky hunch at best. As with any optimisation, it needs measured to confirm the expected gains emerge in practice. Speaking of which…
On the Nature of Faustian Pacts
In this post I’ve tried to give a rundown of PGO from the perspective of the game developer, to stake out my position that yes it absolutely can be used to improve a game’s performance. Just because it can, though, doesn’t mean it should. Personally, I think The Many Faces of PGO could do more to warn devs PGO is kind of a deal with the devil. In some cases, ~10-20% better CPU performance is what you need to get your game over the line - but not always.
The immediate danger, not only of this technique but also similar methods like LTO and PLO, is introducing unexpected bugs. Come to think of it, that’s just as true of -O3 optimisations: when you tell the compiler to get aggressive, it gets aggressive. This doesn’t so much create problems as expose them, usually where there’s something subtle but off about the source code. Even though it’s not as risky as LTO, you only enable PGO towards the end of a project, and I’ve certainly not seen any guarantees it won’t cause trouble once you do.
If your code doesn’t outright break, congratulations… you might just have made it slower. The devil, as ever, is in the details. Telemetry data need to reflect the actual workload of a game. Otherwise, the compiler risks misidentifying hot paths as cold and tuning them for size rather than speed, or vice versa. By only completing part of a playthrough - or more egregious still, playing unlike any end user would - you risk guiding the compiler to so-called optimisations that turn out worse than doing nothing.
Running llvm-profdata merge with --sparse=true set is an accepted workaround for partial data, at least. As I understand it (and I’d certainly welcome any corrections) .profdata files contain a profile for every function in the codebase, even ones that don’t call; sparse .profdata strips those trivial cases. This makes a difference for, say, a hot function in part of the game someone forgot to test. With sparse telemetry data, the compiler can’t see it never calls: the function is technically unprofiled, and as such optimised however it would be with PGO disabled! Of course, cold functions that never call are also stripped, and won’t necessarily be optimised for size like they should, but a slightly bigger executable seems a reasonable trade-off for the extra performance failsafe.
Collecting any data though, not matter how sparse, is still going to take time. If you’re lucky, you can offload that work to QA, but you need to coordinate. Don’t send them instrumented builds when they’re doing performance checks, and don’t ask them to collect data that you know will go stale very quickly. Changing compiler flags, even, can completely invalidate your current batch of telemetry data. The awesome-pgo repo finds that on toggling LTO or bumping your -O level, then collecting a second profile, llvm-profdata overlap will find literally no overlap before and after. All profiles have a lifespan, so you’ll need to fresh data at every significant milestone. For efficiency’s sake, I’d recommend setting up PGO early on a new project, trying a test run to estimate the expected gains, then leave it alone until you’ve enabled LTO and/or any other major optimisations.
So yes, profile-guided optimisations are a deal with the devil, and like any deal with the devil you’d be well-advised to read the small print. The saving grace is, if things do go wrong, you can literally just turn the -fprofile-use flag back off and move on with your life; these optimisations are entirely reversible. If you too would like to live deliciously then I heartily, heartily recommend you give PGO a try… but if it sucks, hit da bricks!!